All Courses for £49
Spatial data in Python refers to geographic or location-based data that can be analysed using libraries like GeoPandas and Shapely. It includes coordinates, maps, and spatial relationships. Moreover, Python allows you to process and visualise this data efficiently. As a result, it is widely used in GIS and data science.


Course Curriculum
| Section 01: Introduction | |||
| Introduction | 00:14:00 | ||
| Section 02: Setup and Installations | |||
| Python Installation | 00:03:00 | ||
| Installing Bokeh | 00:04:00 | ||
| Section 03: Data Preparation | |||
| Data Preparation | 00:24:00 | ||
| Section 04: Data Visualization | |||
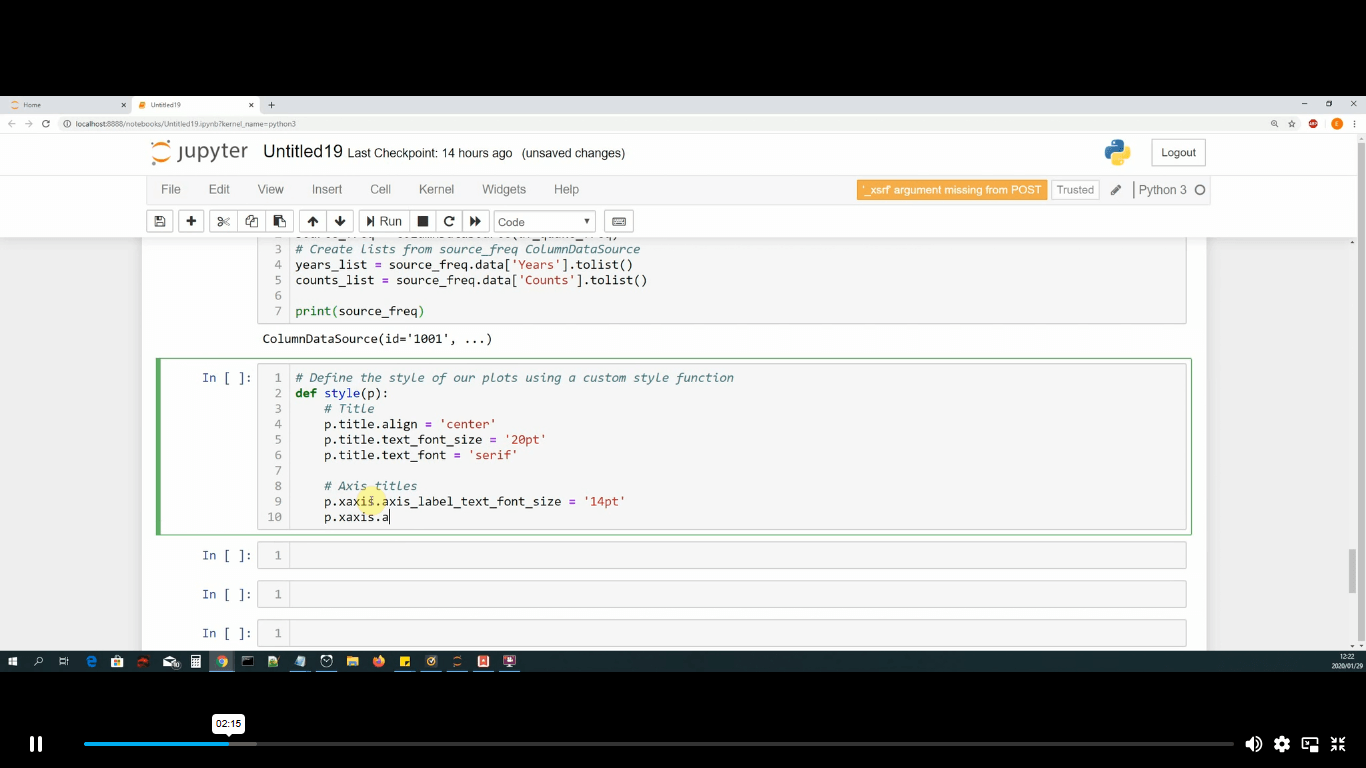
| Creating a Bar Chart | 00:18:00 | ||
| Creating a Line Chart | 00:12:00 | ||
| Creating a Doughnut Chart | 00:22:00 | ||
| Creating a Magnitude Plot | 00:31:00 | ||
| Creating a Geo Map Plot | 00:20:00 | ||
| Creating a Grid Plot | 00:12:00 | ||
| Section 05: Machine Learning | |||
| Data Pre-processing | 00:21:00 | ||
| Building a Predictive Model | 00:21:00 | ||
| Building a Prediction Dataset | 00:07:00 | ||
| Section 06: Building the Dashboard | |||
| Adding predicted data to our plots – Part 1 | 00:13:00 | ||
| Adding predicted data to our plots – Part 2 | 00:14:00 | ||
| Adding predicted data to our plots – Part 3 | 00:15:00 | ||
| Adding the Grid Plot | 00:08:00 | ||
| Section 07: Creating the Dashboard Server | |||
| Installing Visual Studio Code | 00:01:00 | ||
| Creating the Project and Virtual Environment | 00:08:00 | ||
| Building and Running the Server | 00:12:00 | ||
| Section 08: Project Source Code | |||
| Resources | 00:00:00 | ||
| Order Your Certificate | |||
| Order Your Certificate | 00:00:00 | ||
Related Courses