Popular Courses

Brand
Awarding body image

Trading and Financing: Candlestick Pattern

Overview of Trading and Financing: Candlestick Pattern Course

Candlestick charts are widely used by traders and analysts to understand market behaviour and identify potential trading opportunities. This candlestick pattern course is designed to help learners understand how candlestick formations can provide valuable insights into price movements, market sentiment, and trading activity.

The course explains how candlestick charts are structured and how different patterns can help traders interpret market activity. You will learn about trend identification, chart analysis, market psychology, price action, and trading decision-making processes.

Moreover, this candlestick trading course introduces important concepts related to technical analysis, market trends, support and resistance levels, price behaviour, and trading strategy development.

In addition, the training focuses on helping learners understand how chart patterns can support better market observation, improve analytical thinking, and contribute to more structured market analysis.

Furthermore, the course highlights practical approaches used to identify trading signals, evaluate market conditions, recognise trend changes, and interpret buying and selling pressure within financial markets.

The course also explains how candlestick analysis can be combined with broader market research, technical indicators, and trading plans to support a more comprehensive approach to market evaluation.

Additionally, learners will explore how market psychology influences price movements and how candlestick formations can reflect changing market sentiment and trader behaviour.

By the end of the course, learners will have a strong understanding of technical analysis course concepts, candlestick pattern interpretation, and chart analysis techniques used to assess financial market conditions and trading opportunities.

Exclusive Course Glimpse

Description of Trading and Financing: Candlestick Pattern Course

This stock market trading course explains how candlestick patterns are used to analyse financial markets, interpret price movements, and support informed trading decisions through technical analysis.

You will also explore price action trading course topics related to chart formations, trend analysis, reversal signals, continuation patterns, support and resistance levels, market sentiment, and trading behaviour.

Moreover, the course introduces important concepts such as candlestick interpretation, market psychology, price action analysis, trend recognition, and chart-based decision-making techniques used by traders and market analysts.

In addition, learners will gain an understanding of how different candlestick formations can provide insights into buying and selling pressure, potential trend changes, and overall market conditions.

What You Will Learn

  • Understand candlestick chart fundamentals
  • Learn common candlestick patterns
  • Explore trend analysis techniques
  • Understand market sentiment indicators
  • Learn chart reading methods
  • Improve technical analysis knowledge
  • Understand support and resistance concepts
  • Develop trading analysis skills
  • Learn reversal and continuation patterns
  • Understand price action principles
  • Explore market behaviour analysis
  • Build confidence in chart interpretation and market evaluation

Why Choose Us?​

  • Beginner-friendly learning experience
  • Simple and practical explanations
  • Flexible online study access
  • Real market-based examples
  • Step-by-step lesson progression
  • Supports trading knowledge development
  • Focus on chart interpretation skills

Certificate of Achievement

Upon successful completion, you will qualify for the UK and internationally-recognised CPD certificate.

This helps you:

  • Improve your CV
  • Demonstrate market analysis knowledge
  • Support finance-related career development
  • Build confidence in chart interpretation
  • Strengthen professional learning
Nextgen Certificate

Who Is This Course For?​

  • Beginner traders
  • Investors
  • Finance students
  • Market enthusiasts
  • Technical analysis learners
  • Anyone interested in trading education

Requirements of Trading and Financing: Candlestick Pattern Course

  • Basic English understanding
  • Interest in financial markets
  • Internet connection
  • Any digital device
  • No previous trading experience required

Career Path of Trading and Financing: Candlestick Pattern Course

Completing this candlestick pattern course can support opportunities across financial services, market research, investment support, and trading-related environments. Moreover, technical analysis skills are valuable for interpreting market trends, evaluating price movements, and supporting trading decisions.

Common roles include:

Trading Assistant:
Support trading activities by monitoring financial markets, tracking price movements, and preparing reports

Market Analysis Assistant:
Assist with analysing market data, chart patterns, and financial trends to support decision-making

Investment Research Support Officer:
Support investment research by gathering data, reviewing market information, and preparing analysis reports

Financial Markets Coordinator:
Assist with coordinating market-related activities, reporting processes, and operational tasks

Trading Operations Associate:
Support trading operations, transaction processing, and compliance-related activities

Independent Market Analyst:
Conduct market analysis using technical indicators and candlestick patterns to evaluate trading opportunities

Career opportunities may vary depending on qualifications, experience, regulations, market conditions, and industry requirements.

Order Your Certificate

To order your Certificate, we kindly invite you to visit the following link

Frequently Asked Questions - of Trading and Financing: Candlestick Pattern Course

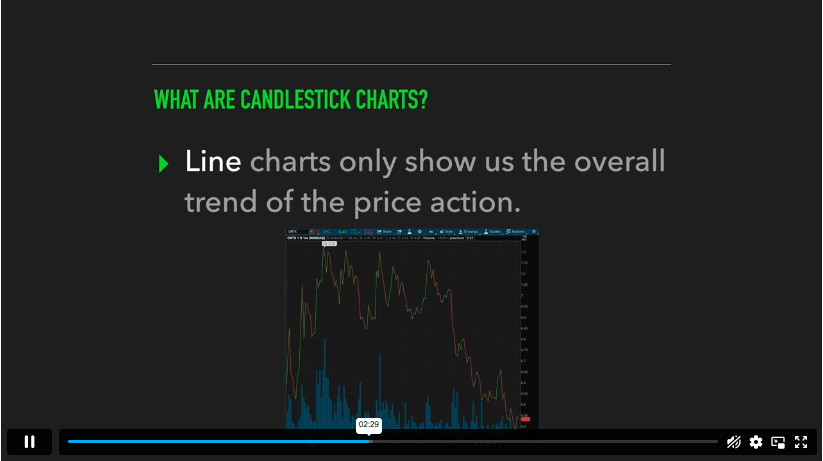
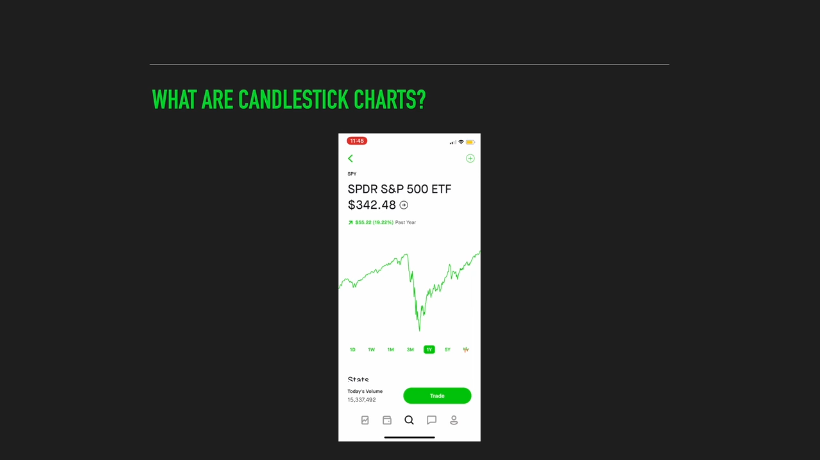
A candlestick pattern course teaches how to read candlestick charts, identify trading signals, and analyse market behaviour using chart formations and price action techniques.

Yes, this candlestick trading course is designed for beginners and explains candlestick analysis, chart interpretation, and trading concepts in a simple and practical way.

You will learn chart reading, trend identification, candlestick formations, support and resistance concepts, market structure analysis, and technical analysis techniques used in financial markets.

Candlestick patterns help traders understand market sentiment, recognise potential trend changes, identify trading opportunities, and analyse price movements more effectively.

Yes, online learning allows you to study candlestick trading, chart analysis, and technical market concepts from anywhere at your own pace.

This course is suitable for beginner traders, investors, finance students, market enthusiasts, and anyone interested in technical market analysis.

Course Curriculum

Trading and Financing: Candlestick Pattern
Course Promo 00:02:00
Module 01: Candlestick Charts 00:05:00
Module 02: Anatomy of Candlesticks 00:04:00
Module 03: Supply and Demand 00:09:00
Module 04: Support and Resistance 00:12:00
Module 05: Standard Doji Candlesticks 00:05:00
Module 06: Dragonfly Doji 00:03:00
Module 07: Gravestone Doji 00:06:00
Module 08: Reversal Candlestick Patterns- Engulfing Candles 00:08:00
Module 09: Morning and Evening Star Patterns 00:09:00
Module 10: Hammer and Hanging Man Candles 00:07:00
Module 11: Continuation Candlestick Pattern: Mat Hold 00:05:00
Module 12: Continuation Candlestick Pattern: 3 Method Pattern 00:06:00
Module 13: Candlestick Gaps 00:03:00
Module 14: Gap Close Reversal Strategy 00:05:00
Module 15: Trading Platform 00:30:00
Module 16: Trading Practise 00:07:00
Assignment
Assignment -Trading and Financing: Candlestick Pattern 00:00:00
Order Your Certificate
Order Your Certificate 00:00:00

Related Courses

No course found

A product of

© 2026 NextGen Learning. All rights reserved

Home Search Cart Offers
Select your currency
GBP Pound sterling